See PromQL for more information. You can change the time-frame using the calendar icon. The query result (time series) is displayed in the form of a graph.
Alert Conditions
Alert conditions determine when alerts are triggered. The options are:
Static threshold
Dynamic change detection
Forecast
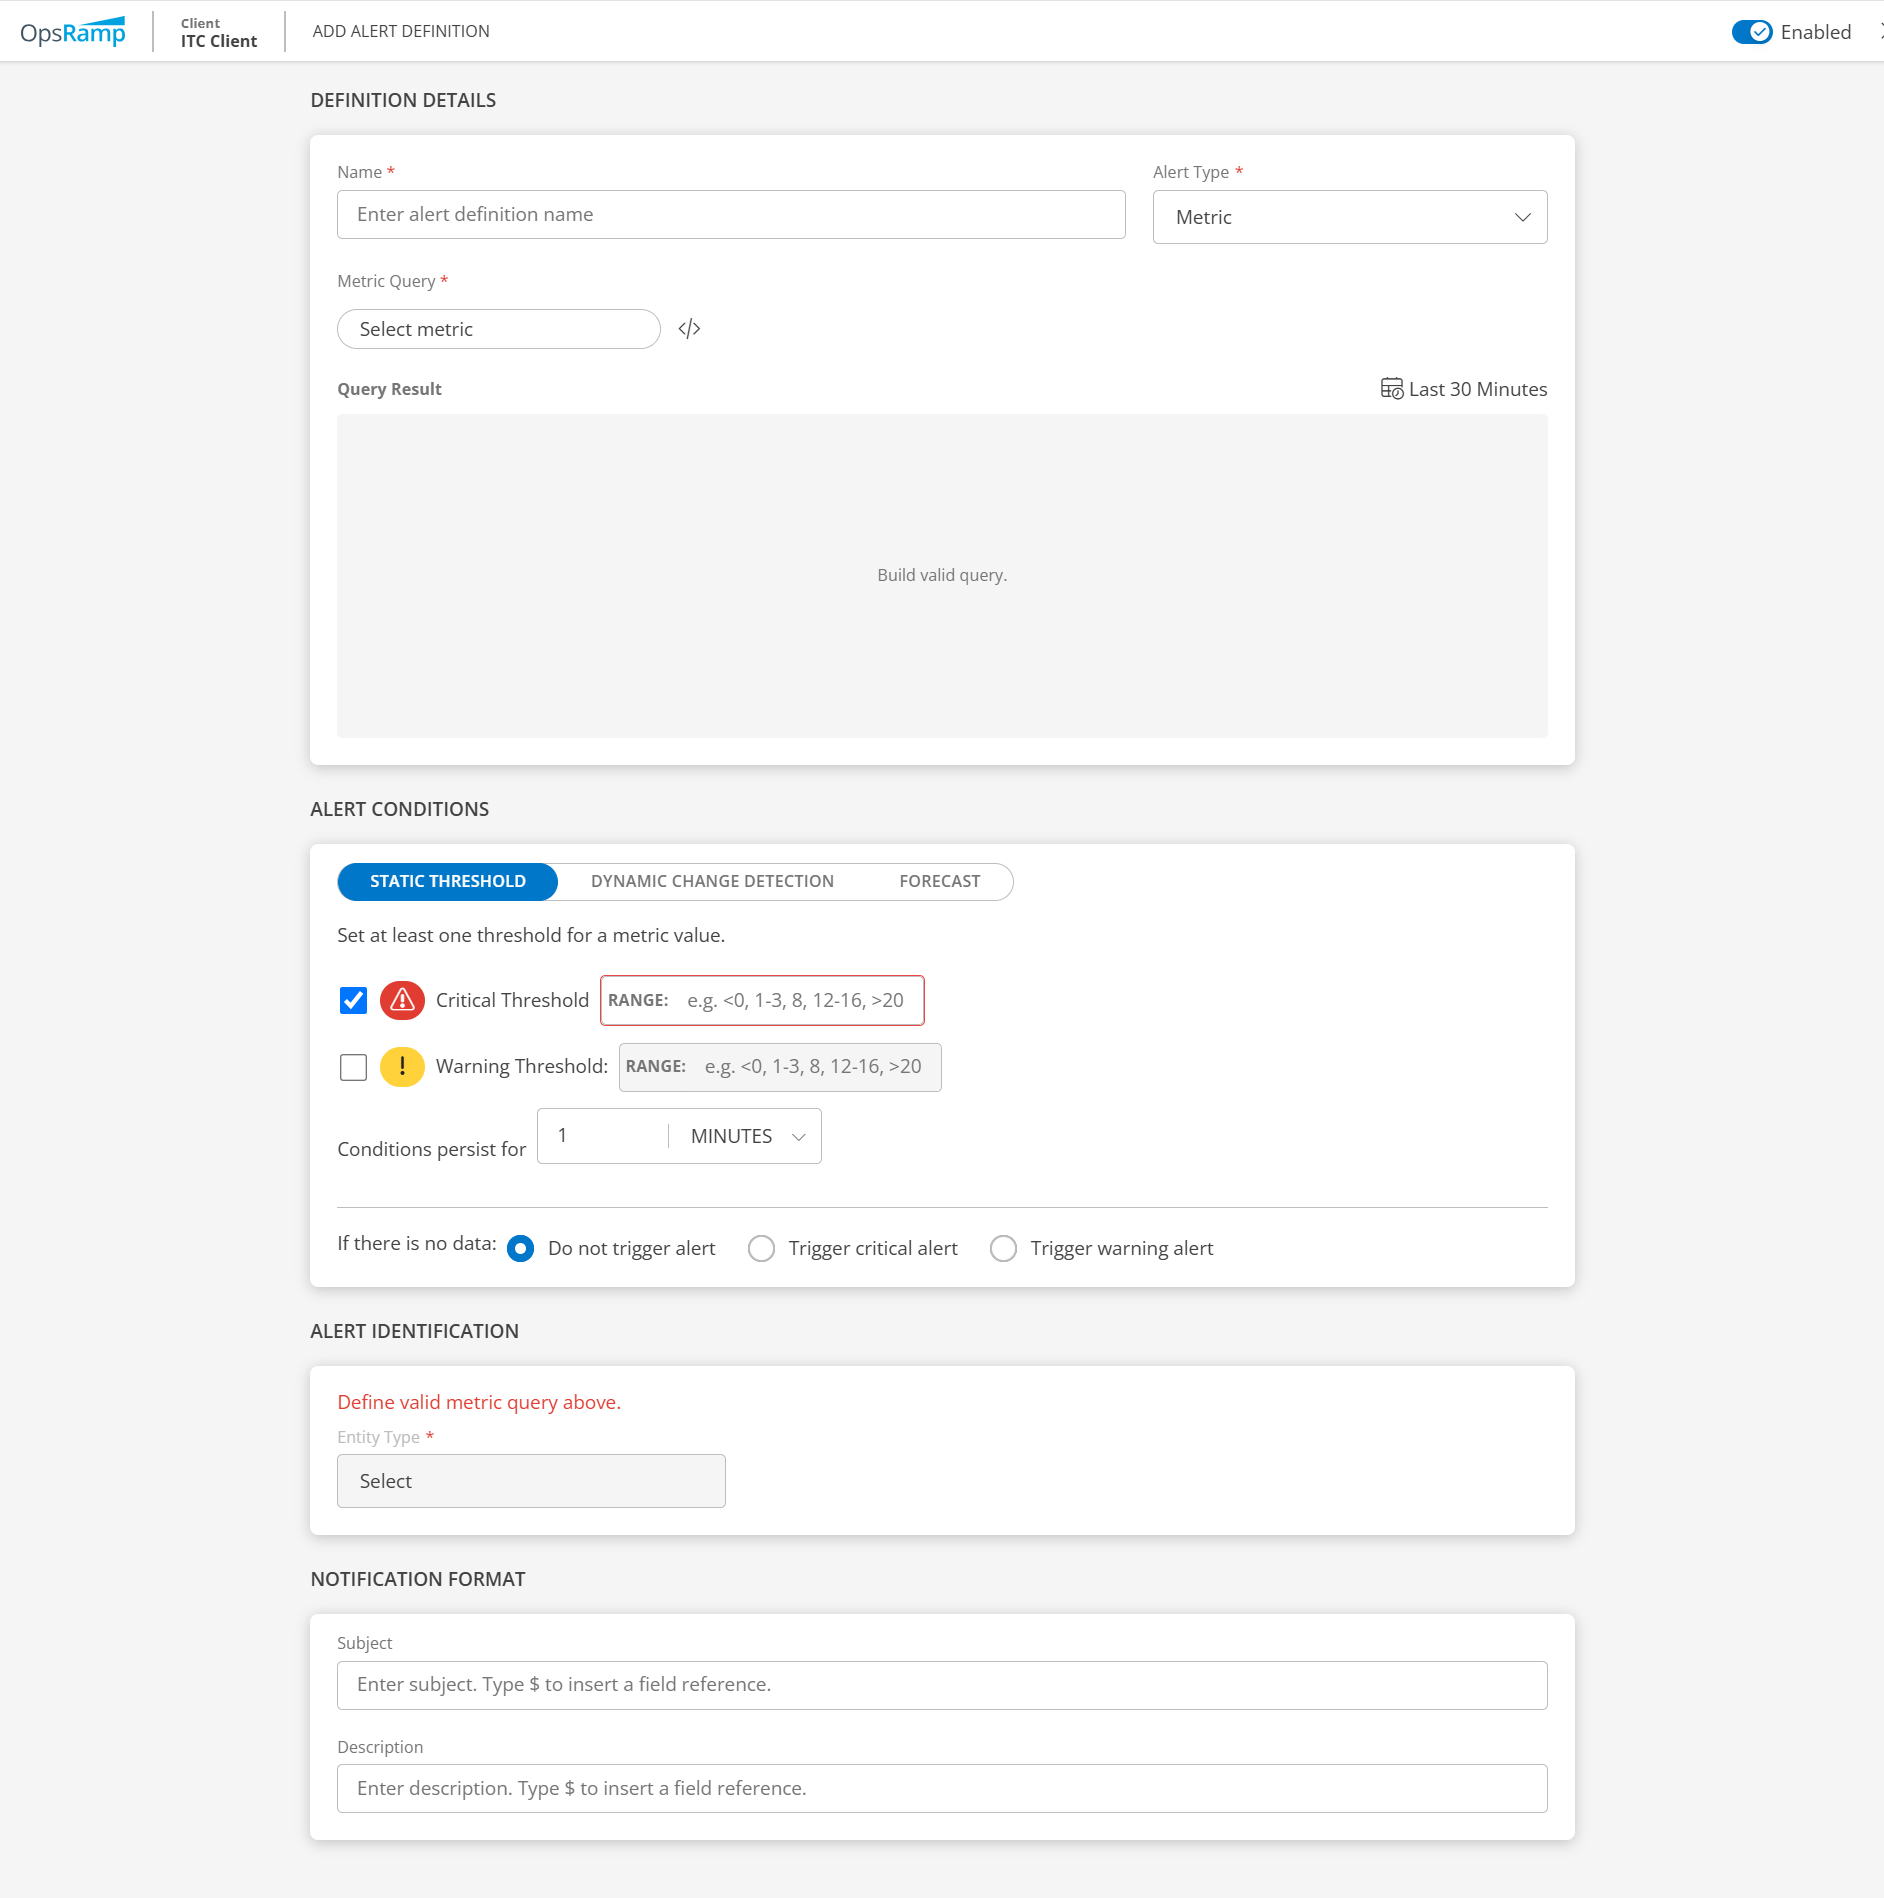
Static Threshold The Static Threshold feature allows you to set thresholds for a metric value. You can also set conditions based on which the alerts are triggered.
Critical Threshold: Enter a critical threshold value. You can enter either a single value or a range.
Note
You can specify negative values as thresholds. Examples: 5, -5, =-5, 5-6, -6-6, -9–6, <5, <-5, <5, <=-5, !=-5, !=5
Warning Threshold: Enter a warning threshold value. Enter a single value or a range.
Note
You can specify negative values as thresholds. Examples: 5, -5, =-5, 5-6, -6-6, -9–6, <5, <-5, <5, <=-5, !=-5, !=5
You can set both critical and warning thresholds or set only one threshold based on your requirements.
Conditions persist for: To avoid anomalous spikes, you can set a condition for an alert to trigger only if the metric value exceeds the thresholds persistently for some time.
The default time is set as 1 minute.
Example:
The above screenshot shows the latest data point as 53.2.
If the metric value is above the threshold for 1 minute continuously, only then is the alert triggered.
Set the critical threshold as 50 and warning threshold as 40.
If the metric value reached 80 and came back to 45, then a warning alert will be triggered.
If there is no data: If there is no data coming in, then you can choose one of the options:
Do not trigger alert - No alert will be triggered, if no data comes in.
Trigger critical alert - A critical alert will be triggered if no data comes in.
Trigger warning alert - A warning alert will be triggered, if no data comes in.
If the device stops sending data due to some reason, like the agent is offline, then the graph will show empty. There will be no graph data.
Note
A No Data alert is triggered only after metric data has been received at least once, followed by a continuous 30-minute period with no data.
If the alert definition is created when no metric data exists, the alert will not trigger.
The No Data alerts are generated at the client level, based on the corresponding alert definition.
Dynamic Change Detection The Dynamic Change Detection feature allows you to set up intelligent alerts based on statistical deviations from normal behavior in time-series data. This is especially useful for detecting anomalies that deviate significantly from historical trends.
Trigger alert when:
increase,decrease, or increase or decrease of more than 5 (default) standard deviations away from the mean is detected.
Value falls below a lower threshold (optional) to exceeds upper threshold (optional)
the conditions persist for 5 (default) MINUTES.
Evaluate the data over a learning period of the last 4 HOURS (values should be between 1 and 8 hours).
How it works: The system analyzes the last 4 hours of time series data (default value, adjustable between 1 and 8 hours) to calculate the mean and standard deviation. An alert is triggered when the metric value deviates significantly from the mean, breaches the defined thresholds, and the condition persists for the configured duration.
Example: Let us say you are monitoring CPU utilization on a server.
Following are the criteria you configured for the alert:
Condition: Increase
Standard deviation threshold: 5
Value exceeds threshold: 90% (optional upper limit)
Persistence duration: 5 minutes
Learning period: Last 4 hours
If the CPU usage suddenly spikes to 95% and stays above that level for at least 5 minutes, and that value is more than 5 standard deviations above the historical average, the system will trigger an alert.
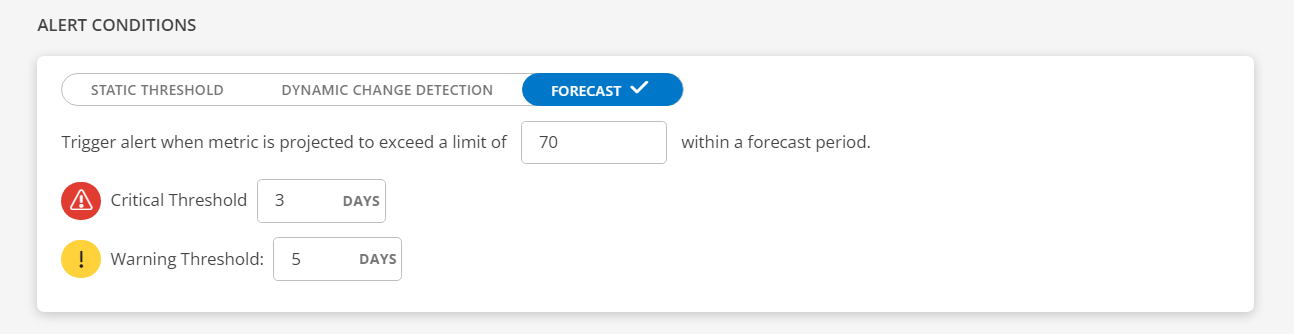
Forecast: The forecasting typically refers to predicting or estimating potential issues or events that might trigger an alert. This involves analyzing historical data, patterns, and trends to anticipate situations that could lead to issues or other predefined conditions.
Provide the information in the fields.
Limit: This feature monitors specific metrics and triggers an alert when the projected value of the metric is forecasted to exceed a predefined limit within a specified forecast period. The limit is a metric unit and predefined limits are set for each metric, determining the acceptable range. For example, CPU usage from 1% to 100%, disk space from 1KB to 100GB, network speed from 1Bps to 1Gbps.
Critical Threshold: Enter a critical threshold value. Enter a number. Example: 3 days
Warning Threshold: Enter a warning threshold value. Enter a number. Example: 5 days How it works: It will predict the occurrence when the specified limit is about to be reached and trigger an alert based on the timeframe specified in the critical or warning threshold. The forecasting process will occur once daily starting from the creation of the alert definition.
Note
Operations are not supported while building a query.
Alert Identification
The alert identification section defines the scope of the alert.
Entity Type: Select either Resource or Client. Alerts can be on a specific resource like a server, or a client-level alert.
Note
For Dynamic Change Detection, you can select the Entity Type only as Resource.
Component: Select a component. This is to identify the alert.
Resource Attributes: Define a resource attribute to the alert. These attributes are added to the alert.
Note
The resource attributes can be defined only for Resource entity type.
Select the attribute key and the attribute value from the dropdown boxes. These attributes can be seen in the alert details.
Note
The maximum number of attributes you can select is 4, that is, host, name,UUID, and IP. If you select the attribute value as $name, it will go to the metric and get the value of name and display it in the alert details screen.
Labels: Assign a value to a label. This is reflected in the alert details screen.
Enter the name of the label in the Name box.
Enter the value of the label in the Value box.
Example: If name is id and value is 10, then it will be set as id is 10.
Click Save. The alert definition is saved successfully. You can enable or disable an alert definition, from the Alert Definitions listing screen.
Note
If you delete an alert definition, you must wait 1 hour before creating a new alert definition with the same name.
Notification Format
The Subject and Description entered here will reflect in the alert details screen.
Subject: Enter subject for the alert.
Note
Enter $ to add tokens.
Example: The alert is on the resource with host name: host
Description: Enter alert description.
Note
Enter $ to add definition.
Example: The alert is on the resource with IP: IP These tokens are displayed only after you provide a metric or a query in the Metric Query field.
Alert limitation rule
Due to incorrect configuration of alert definition at the client level, multiple alerts might be generated. These alerts may impact the alert processing. Following are the rules set up to limit alert volume:
When the number of alerts generated for a specific alert definition exceeds 1,700 alerts within the last 1 hour, the system will:
Trigger a Warning Alert.
Send a notification to the user, alerting them about the high volume of alerts associated with a single alert definition.
When the number of alerts continues to increase and breaches 2,000 alerts within the last 1 hour, the system will:
Trigger a Critical Alert to notify the user about the threshold breach.
Automatically disable the alert definition to prevent further alert generation.
Generate a Failure log with detailed information on the alert definition and associated metrics.
Note
The above rules are applicable for all alert conditions: Static Threshold,Dynamic Change Detection, and Forecast.
The alerts (warning or critical) that are generated for the breach, have to be self-healed or suppressed.
Alert Definition limitation
The alert definition processes alerts from PromQL queries that return a maximum of 200,000 time series data points. If this limit is exceeded, no alerts will be generated.
To generate alerts, modify the query to include filters that narrow down the data, or configure alert definitions at the group, site, custom attributes, or service map levels.
This is applicable for all type of thresholds (Static, Change Detection, and Forecast).
Actions on an alert definition
Below are the actions you can perform on an alert definition.
Action
Description
Search
To search for an alert definition:
Click on the search icon available on the Alert Definitions listing screen.
Type the alert definition name in the search box. The search result is displayed.
Filter
Filter alert definitions based on Entity Type and Status:
Click on the Filter dropdown available on the Alert Definitions listing screen.
Select the Entity Type and Status and click Filter. The alert definitions matching the filter criteria are displayed.
View and Edit
To view an alert definition:
Search for the alert definition you want to view.
Hover over the row and click the action menu (three dots).
Select View Details.
Alternatively, click on the Alert definition name to view the details.
To edit an alert definition:
Make the necessary changes on the Definition Details screen.
Click Save. The changes are saved.
Note: If you made any changes to the Metric Query or in the Alert Identification section, a popup dialog box is displayed.
Select the checkbox to mark the alerts associated with the alert definition as Obsolete. They will be available for a period of three months from the current date.
Click Save to save the changes.
View Failure Logs
To view failure logs:
Search for the alert definition for which you want to view the failure logs.
Hover over the row and click the action menu (three dots).
Select View Failure Logs. The failure logs are displayed with the date and time.
Alternatively, click on the Alert definition name and then click Failure Logs on the Definition Details screen to view the failure logs.
Remove
To remove an alert definition:
Search for the alert definition you want to remove.
Hover over the row and click the action menu (three dots).
Select Remove. A confirmation popup is displayed.
Click Remove to remove the alert definition. Alerts associated with the alert definition will be marked as Obsolete. They will be available for a period of three months from the current date.