Introduction
A SysLog monitoring rule filters incoming SysLog events using a RegEx pattern and generates alerts in OpsRamp based on user-defined metric names, component names, alert subjects, descriptions, and severities.
This is a two-step process:
- Define the SysLog rules.
- Install the SysLog Monitor Configuration
Define SysLog rule
Follow these steps to define SysLog rule:
To select your client, click the Client/Partner dropdown from the top-left corner of the dashboards screen. Either type your client’s name in the search box or select your client from the list.
Click Setup > Account. The Account Details screen is displayed.
Click on the Monitoring tile and then click the SYSLOG RULES tab.
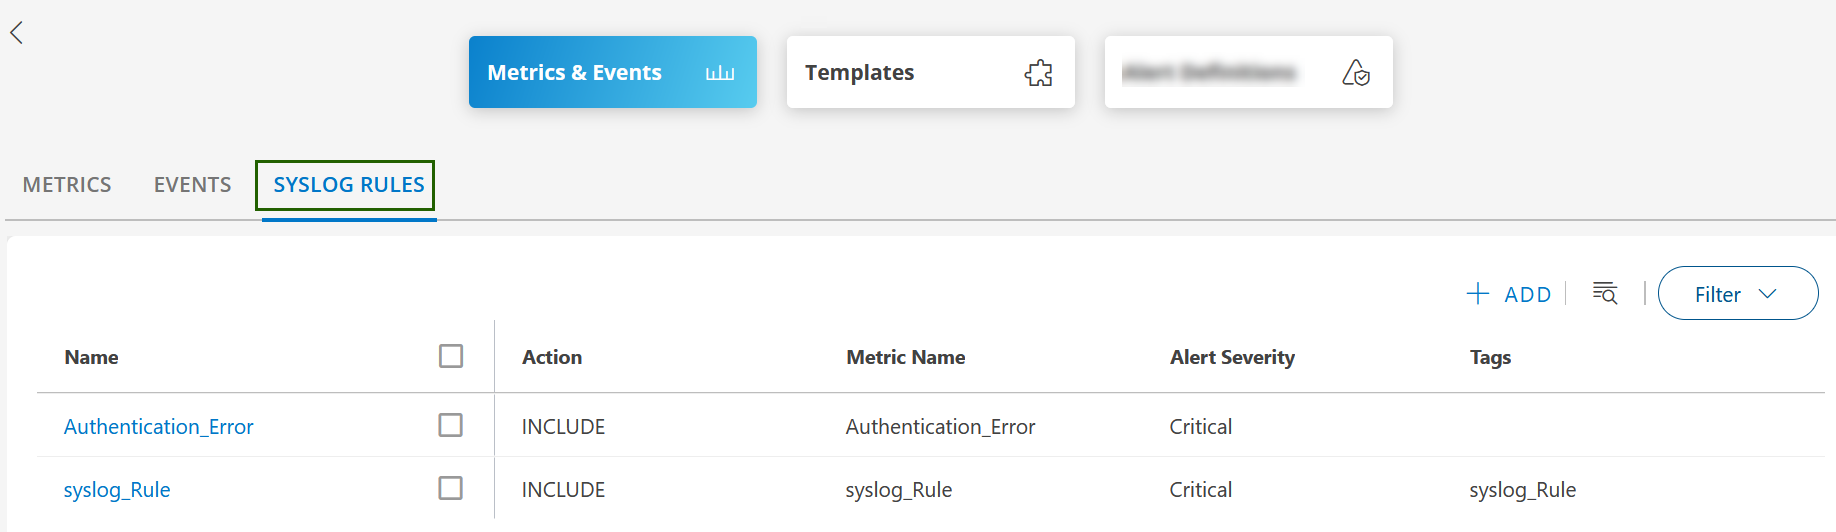
Click +ADD in the SysLog rule listing screen. The ADD SYSLOG RULE screen is displayed.
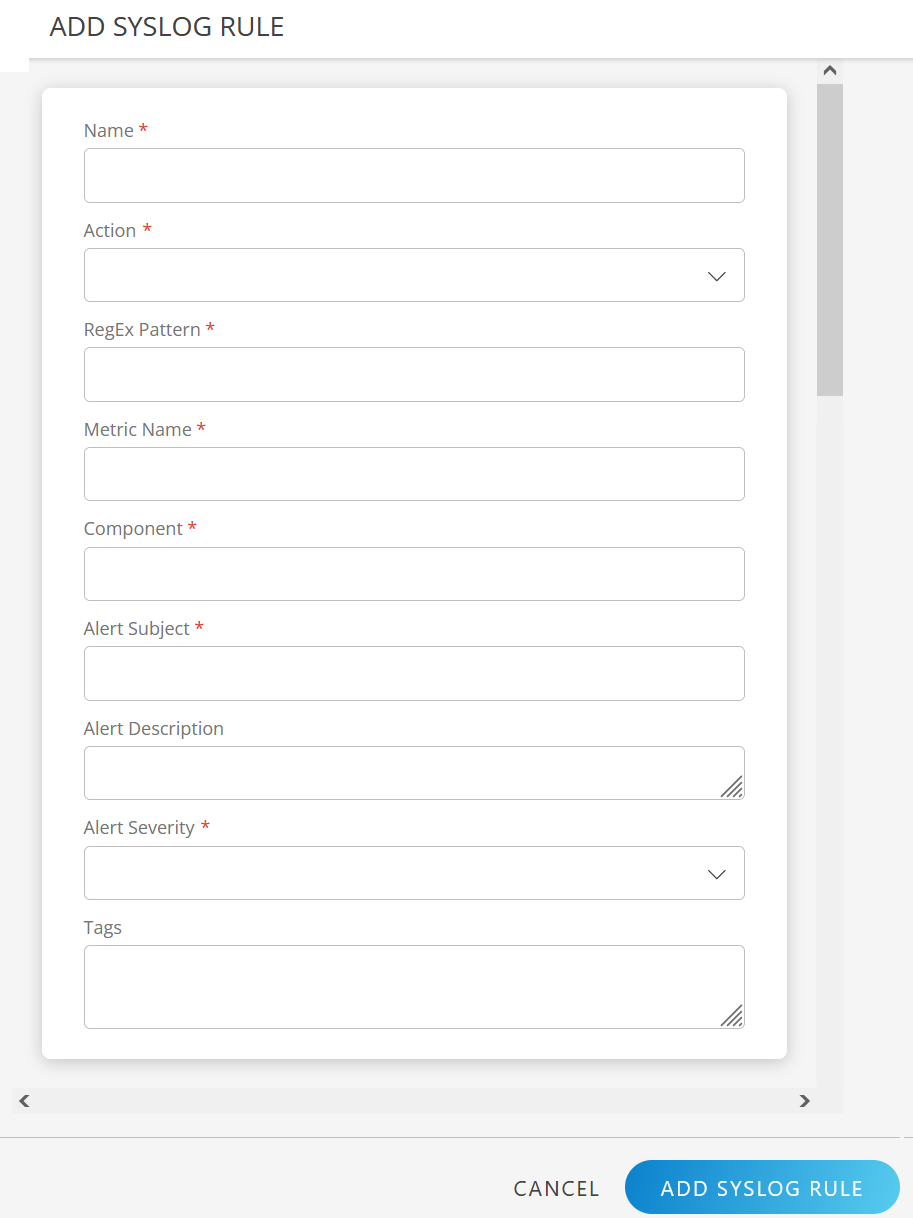
Enter the following information in the ADD SYSLOG RULE screen:
Field Name Field Type Description Name String Enter the Rule name. Action Dropdown Action to apply to messages that match this rule: - INCLUDE: If the event matches a rule, it is processed further.
- EXCLUDE: If the event matches a rule, it will not be processed further.
RegEx Pattern String RegEx pattern to apply for matching messages. Metric Name String User-defined metric name, which can be specified using RegEx. Component String User-defined component name. Alert Subject String User-defined alert subject. Alert Description String User-defined alert description. Alert Severity Dropdown Select an alert severity level: - Critical
- Warning
- Info
- Ok
Tags String User-defined tag name. Click ADD SYSLOG RULE. The SysLog rule is created, and a confirmation message appears.

You can view the rule in the SYSLOG RULES listing screen.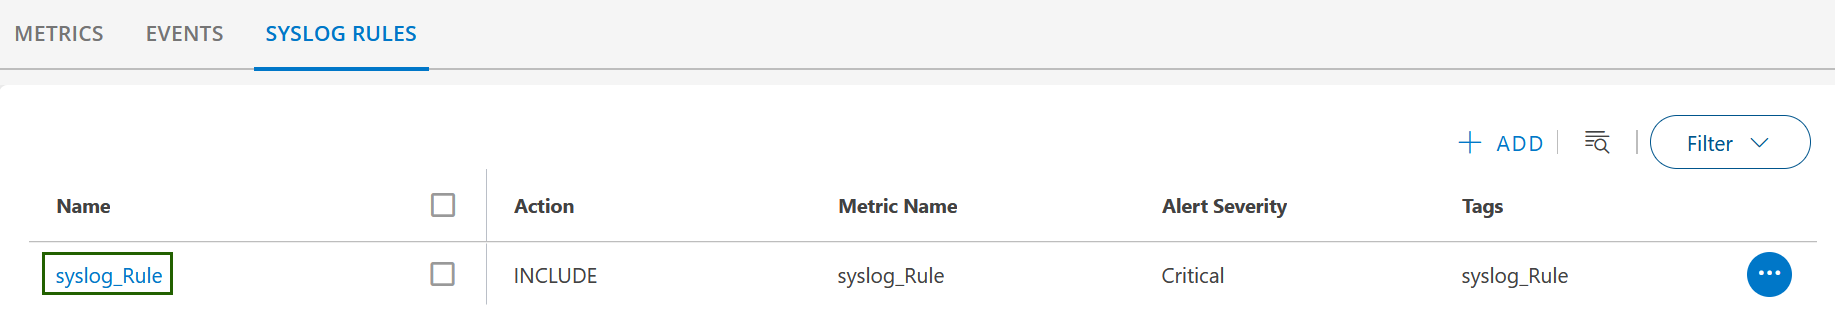
See Syslog Event Logging Overview for more information.