Create a metric
You can create metrics at the Service Provider, Partner, and Client levels.
Note: You cannot delete a metric once it is created.
Follow these steps to create a metric:
To select your client, click the Client/Partner dropdown from the top-left corner of the My Dashboards screen. Either type your client’s name in the search bar or select your client from the list.
Click Setup > Account. The Account Details screen is displayed.
Click on the Monitoring tile.
Click +ADD. The ADD METRIC screen is displayed.
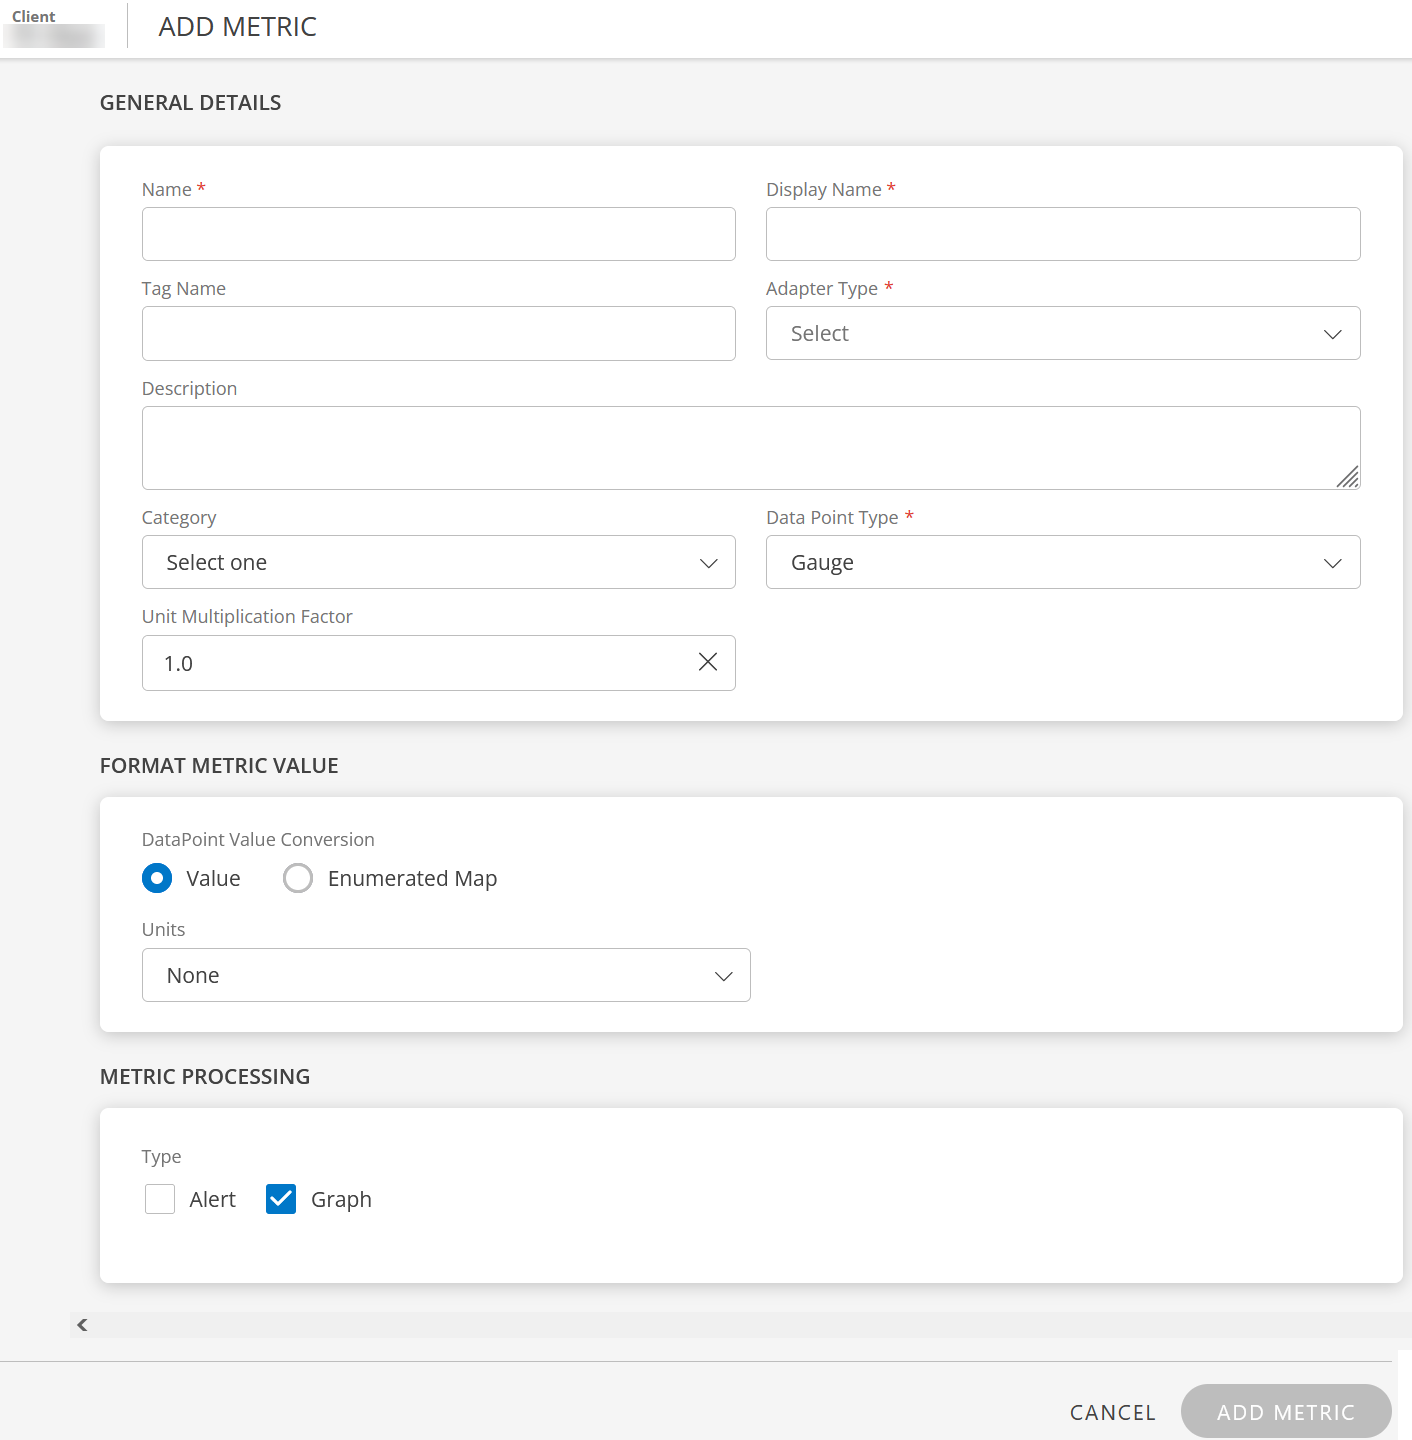
Enter the following information:
GENERAL DETAILS
Field Name Field Type Description Name String Unique name associated with the metric.
See Metric name format for more information.Display Name String Provide a unique display name for the metric.
Example: EMC CLARiiON System Total Raw Space.
Display Name and Name must infer the same purpose.Tag Name String Provide user-defined tags for better filtering. Adapter Type Dropdown Collector type that you want to use to gather metric data. Select Application or JMX. Application Type Dropdown Select Application Type.
This field is displayed if you selected Adapter Type as Application.Class/Attribute path String Enter the class or attribute path.
This field is displayed if you selected Adapter Type as JMX.Description String Provide a description for the metric. Category Dropdown Select appropriate category for the metric. Data Point Type Dropdown Type of data point specification: - Counter Delta - It calculates delta on top of metric value. If the result is less than zero, then it returns zero.
Counter Delta = (Current poll value - Prev poll value) - Counter Rate - It calculates rate on top of metric value. If the result is less than zero, then it returns zero.
Counter Rate = (Current poll value - Prev poll value) / (Current poll time - Prev poll time) - Derive Delta - Not related to RSE. No support in both agent and gateway.
- Derive Rate - Not related to RSE. No support in both agent and gateway.
- Gauge - It returns a direct metric value, which is returned from the script.
- Rate - It calculates rate on top of metric value. If the result is less than zero, then it returns a negative value.
Rate = (Current poll value - Prev poll value) / (Current poll time - Prev poll time) - Delta - It calculates delta on top of metric value. If the result is less than zero, then it returns a negative value.
Delta = (Current poll value - Prev poll value) - None - Same as Gauge
Unit Multiplication Factor Integers and floating point numbers The default value is 1.0. Provide a value to multiply by the data point value that the end device will return.
Example: If the device returns a value of 2 and it is in MB, and if you want to convert it into KB, then the formula is:
2 * (1/1024)
= 2 * 0.0009765625
= 0.001953125 KB.FORMAT METRIC VALUE
Field Name Field Type Description DataPoint Value Conversion Radio button Datapoint value conversion specification: - Value: Value used to convert the metric data point.
- Enumerated Map: Map the datapoint to a state-description pair.
Units Dropdown This field is displayed if you selected Value as DataPoint Value Conversion.
Select a unit according to the metric value.
Example: If the metric returns value in percentage, select Percentage (%).State/Description String This field is displayed if you selected Enumerated Map as DataPoint Value Conversion.
Add state-description pairs for each datapoint value:- State: Enter State represented by the value.
- Description: Enter description associated with the state.
- Click SAVE.
- Click +ENUMERATED MAP to add state-description pairs.
Use Formatted Value In: Select Alert and/or Graph checkboxes as required.METRIC PROCESSING
Field Name Field Type Description Type Checkbox Graph: Select Graph to process metrics in the form of graphs.
Alert: Select Alert to process metrics in the form of alerts.- Warning alerts when metric is: Select the operator.
threshold: Enter a threshold value.
Example: 1, 5.
and repeats: Select the repeat count.
Example: once, thrice. - Critical alerts when metric is: Select the operator.
threshold: Enter a threshold value.
Example: 1, 5.
and repeats: Select the repeat count.
Example: once, thrice. - Alert Subject: Alert subject. This is populated by default and should not be changed.
- Alert Content: Alert description. This is populated by default and should not be changed.
- Counter Delta - It calculates delta on top of metric value. If the result is less than zero, then it returns zero.
Click ADD METRIC. The metric is created and displayed on METRICS listing screen.

View metrics
Follow these steps to view metric information like Name, Adapter Type, Display Name, Description:
To select your client, click the Client/Partner dropdown from the top-left corner of the screen. Either type your client’s name in the search box or select your client from the list.
Click Setup > Account. The Account Details screen is displayed.
Click on the Monitoring tile.
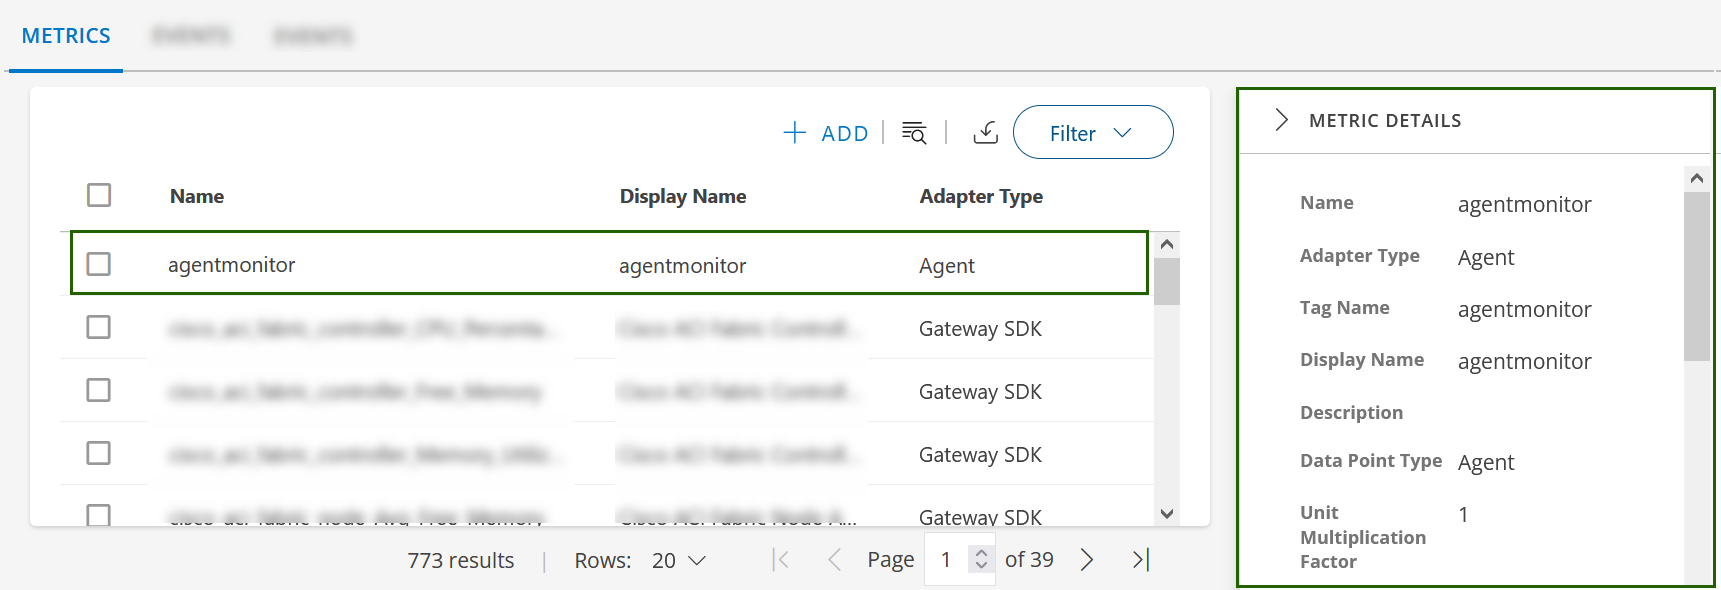
From the METRICS listing screen, click the search icon.
Type the name of the metric in the search box. The metric details are displayed.
Click anywhere in the metric name row. The METRIC DETAILS slide-out is displayed.
Metric name format
The following are acceptable formats for a metric name:
- Metric names should not contain a dot (.), instead use an underscore (_) between the words.
system.cpu.usageis not validsystem_cpu_usageis valid - A metric name can have a maximum of ten underscores “_”. A metric name cannot start or end with an underscore.
- A metric name can contain numeric values (0-9) but cannot start with a numeric value.
- A metric name should be case-insensitive.
- The length of the metric name should be less than or equal to 255, including underscores.
Graphs with New Metrics data
| Property | Expected Behaviour | Workaround / Details |
|---|---|---|
| Graphs plotting frequency Vs Monitoring Frequency | The graph shows raw samples based on default step value: 1min i..e the plotting frequency for graphs irrespective of configured monitoring frequency. |
|
| Graphs plotting behavior |
| To avoid plotting gaps, ensure that the metric collection frequency matches the default graphing frequency or adjust the graphing frequency to match the metric collection intervals which is less than or equal to 5 minutes. The recommend monitoring frequency for any metric should be <= 5 minutes |
| Visualize Real-time data | The data points for new metric graph data are calculatedly plotted every 1 min except at the frequency time-interval. In order to view real-time data, the metric graphs offer displaying the actual timestamps when the data was collected. Status and availability metrics need to show when data collection stopped, indicating a resource or service outage. | Graph > Expand Info section > shows “Real Time Data” option. |
| Metrics Details | In the new metrics system, templates that describe the relationship between different metrics are not available. User might see the legacy metrics name while detailing, which is expected behavior, and these will be slowly transitioned to show in the new metric nomenclature. | To view the relationships between template and metrics, navigate to the Monitors tab where detailed information is provided. |
| Default Time Period for Graphs | Default time-period has been set as 1 Hour from the existing 4 Hour window | Default Time-period is now set 1H |
| Multiple metrics | The new metric visualization supports only a single metric graph data. | The new metric visualization does not support multiple metric graph data visualization due to pagination and hence it is not available. |