Open the dashboard menu to:
- Create a dashboard using the dashboard builder tools.
- Import a dashboard.
- Upload a JSON file that can be used to instantiate a dashboard.
Create dashboards manually
To create a dashboard manually:
- Create the dashboard.
- Create a metric, text, or image tile.
- Enter a PromQL query.
- Select from Combo, Value, List or Honeycomb chart type.
- Customize the visualization.
- View the dashboard on the main dashboard page.
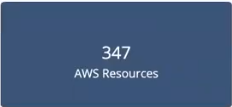
Example 1:
PromQL query to return multiple time series: sum(usage_cloud_provider_aws)
Visualization:
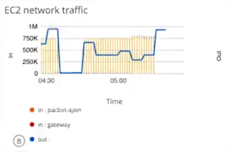
Example 2:
PromQL query to graph the inbound and outbound traffic on an ec2 instance: usage_cloud_provider_aws{instance="ec2.instances"}
Visualization:
Dashboard actions
| Action | Description |
|---|---|
| Set Default Dashboard | Selects a dashboard to be the first to be displayed when the main Dashboard 2.0 page is visited. |
| Copy | Copies a dashboard to the specified collection. Dashboards must have a unique name. |
| Move | Moves a dashboard to the specified collection. |
| Export | Exports the dashboard as a JSON file, which can be imported using the **Import Dashboard** menu option. |
| Rename | Renames the dashboard. |
| Delete | Deletes the dashboard. |