Introduction
Syslog event monitoring provides a centralized approach to capture and analyze log events generated by network infrastructure, systems, and applications. It plays a crucial role in incident detection, troubleshooting, auditing, and maintaining operational visibility across the environment.
Prerequisites
The following prerequisites apply to both Syslog Alerting and Syslog Collection:
- The gateway server must be installed in the managed environment.
- The UDP protocol must be enabled. Port 514 (default Syslog port) must be open and accessible, and devices must be configured to send Syslog messages to the correct IP address and port.
The following prerequisites are required only for Syslog Collection:
- A gateway with OpenTelemetry (OTel) integration is required. For more information see, Gateway Managed OTEL Collector.
- Enable Log Management at the client level. This permission is required to ingest and forward logs to the cloud.
- Ensure the environment uses OpsRamp NextGen Gateway version 21.1.0 or later. Using the latest version is recommended for complete feature coverage and improvements.
- Enable Syslog Collection to forward Syslog messages.
Monitor syslog events through OpsRamp tool
You should create rules and configuration profiles to monitor required syslog events through the OpsRamp tool. OpsRamp tool then generates alerts for the required syslog events as per rules and configuration profiles.
What is SysLog monitoring rule?
The syslog monitoring rule filters syslog events based on a RegEx pattern and generates alerts in the OpsRamp UI according to user-specified metric names, component names, alert subjects, alert descriptions, and alert severities.
Tip
If you are unfamiliar with RegEx, there are free websites that provide RegEx reference materials, tutorials, and development tools to fine-tune the RegEx expressions you might need to define rules.You can define the metric, component, alert subject, and alert description in two ways:
Static approach
In static approach, you define fixed values for the metric name, component name, alert subject, and alert description based on syslog events.
Example:
If you want to generate an alert when a syslog message contains the term invalid_user, you would create a rule specifying RegEx as invalid_user.
Whenever a syslog event matches RegEx, OpsRamp tool generates an alert using the predefined metric name, component name, alert description, and alert subject.
The screenshot below illustrates this setup.
Sample Syslog Event: “
Jun 17 12:45:02 localhost sshd[1234]: Failed password for invalid_user from 192.168.1.200 port 5678 ssh2”
Dynamic approach
With this approach, you can dynamically derive the metric name, component name, description, and subject from syslog event using the grouping concept in RegEx. Additionally, it supports predefined macros that can be used when defining rules.
Sample Syslog Event:
"devname="abcserver" devid="F22004743" eventtime=1714470971124258725 tz="+0200" logid="0100040704" type="event" subtype="system" level="notice" vd="root" logdesc="System performance statistics" action="perf-stats" msg=Performance statistics: average CPU: 0, memory: 4, concurrent sessions: 20517, setup-rate: 1"Example: If you want to go with dynamic approach to generate an alert and derive the metric name, component name, description, and subject from the syslog message and want to see the logdesc value as the metric name, the devname value as the component, the msg=Performance statistics value as the subject, and the entire syslog event message as the description. When you receive the above syslog event, you have to define the RegEx as mentioned below:
Regex pattern:
"(devname=(.*)devid.*(logdesc=(.*)(action=(.*)(msg=(.*(Performance statistics).*)))))"Alert Details in OpsRamp: Below is a sample alert.
The rules have to be defined as mentioned in the screenshot.Metric name: system performance statistics
Component name: abcserver
Subject: Performance statistics: average CPU: 0, memory: 4, concurrent sessions: 20517, setup-rate: 1
Description: devname=“abcserver” devid=“F22004743” eventtime=1714470971124258725 tz="+0200" logid=“0100040704” type=“event” subtype=“system” level=“notice” vd=“root” logdesc=“System performance statistics” action=“perf-stats” msg=Performance statistics: average CPU: 0, memory: 4, concurrent sessions: 20517, setup-rate: 1
Supporting Macros
- ${received.syslog.message}: It provides a description of the event or message. In a syslog event message, the description typically provides specific details about what occurred or what was detected by the system or application.
- ${timestamp}: It shows the timestamp of the event when it was received at the gateway in Unix Time.
Configure SysLog monitor
Follow these steps to configure syslog monitor:
To select your client, navigate to All Clients, and click the Client/Partner dropdown menu.
Note: You may either type your client’s name in the search bar or select your client from the list.Navigate to Setup > Account. The Account Details screen is displayed.
Click Integrations. The Installed Integrations screen is displayed with all the installed applications.
Note: If you do not have any installed applications, you will be navigated to the Available Integrations page with all the available applications along with the newly created application.Click +ADD on the Installed Integrations page.
Note: Search for the integration either by entering the name of the integration in the search bar or by selecting the category of the integration from the All Categories dropdown list.Click +ADD in the SysLog Monitor Configuration application tile.
Syslog now supports both alerting and log collection. Two options are provided in Syslog configuration.
- Syslog Alerting
- Syslog Collection
Syslog Alerting
Enable this option to process Syslog messages as alerts. Based on the configured filters, if the conditions are met, Syslog alerts are generated for the corresponding devices in the OpsRamp platform. If the conditions are not met, the messages are not processed as alerts.
Note
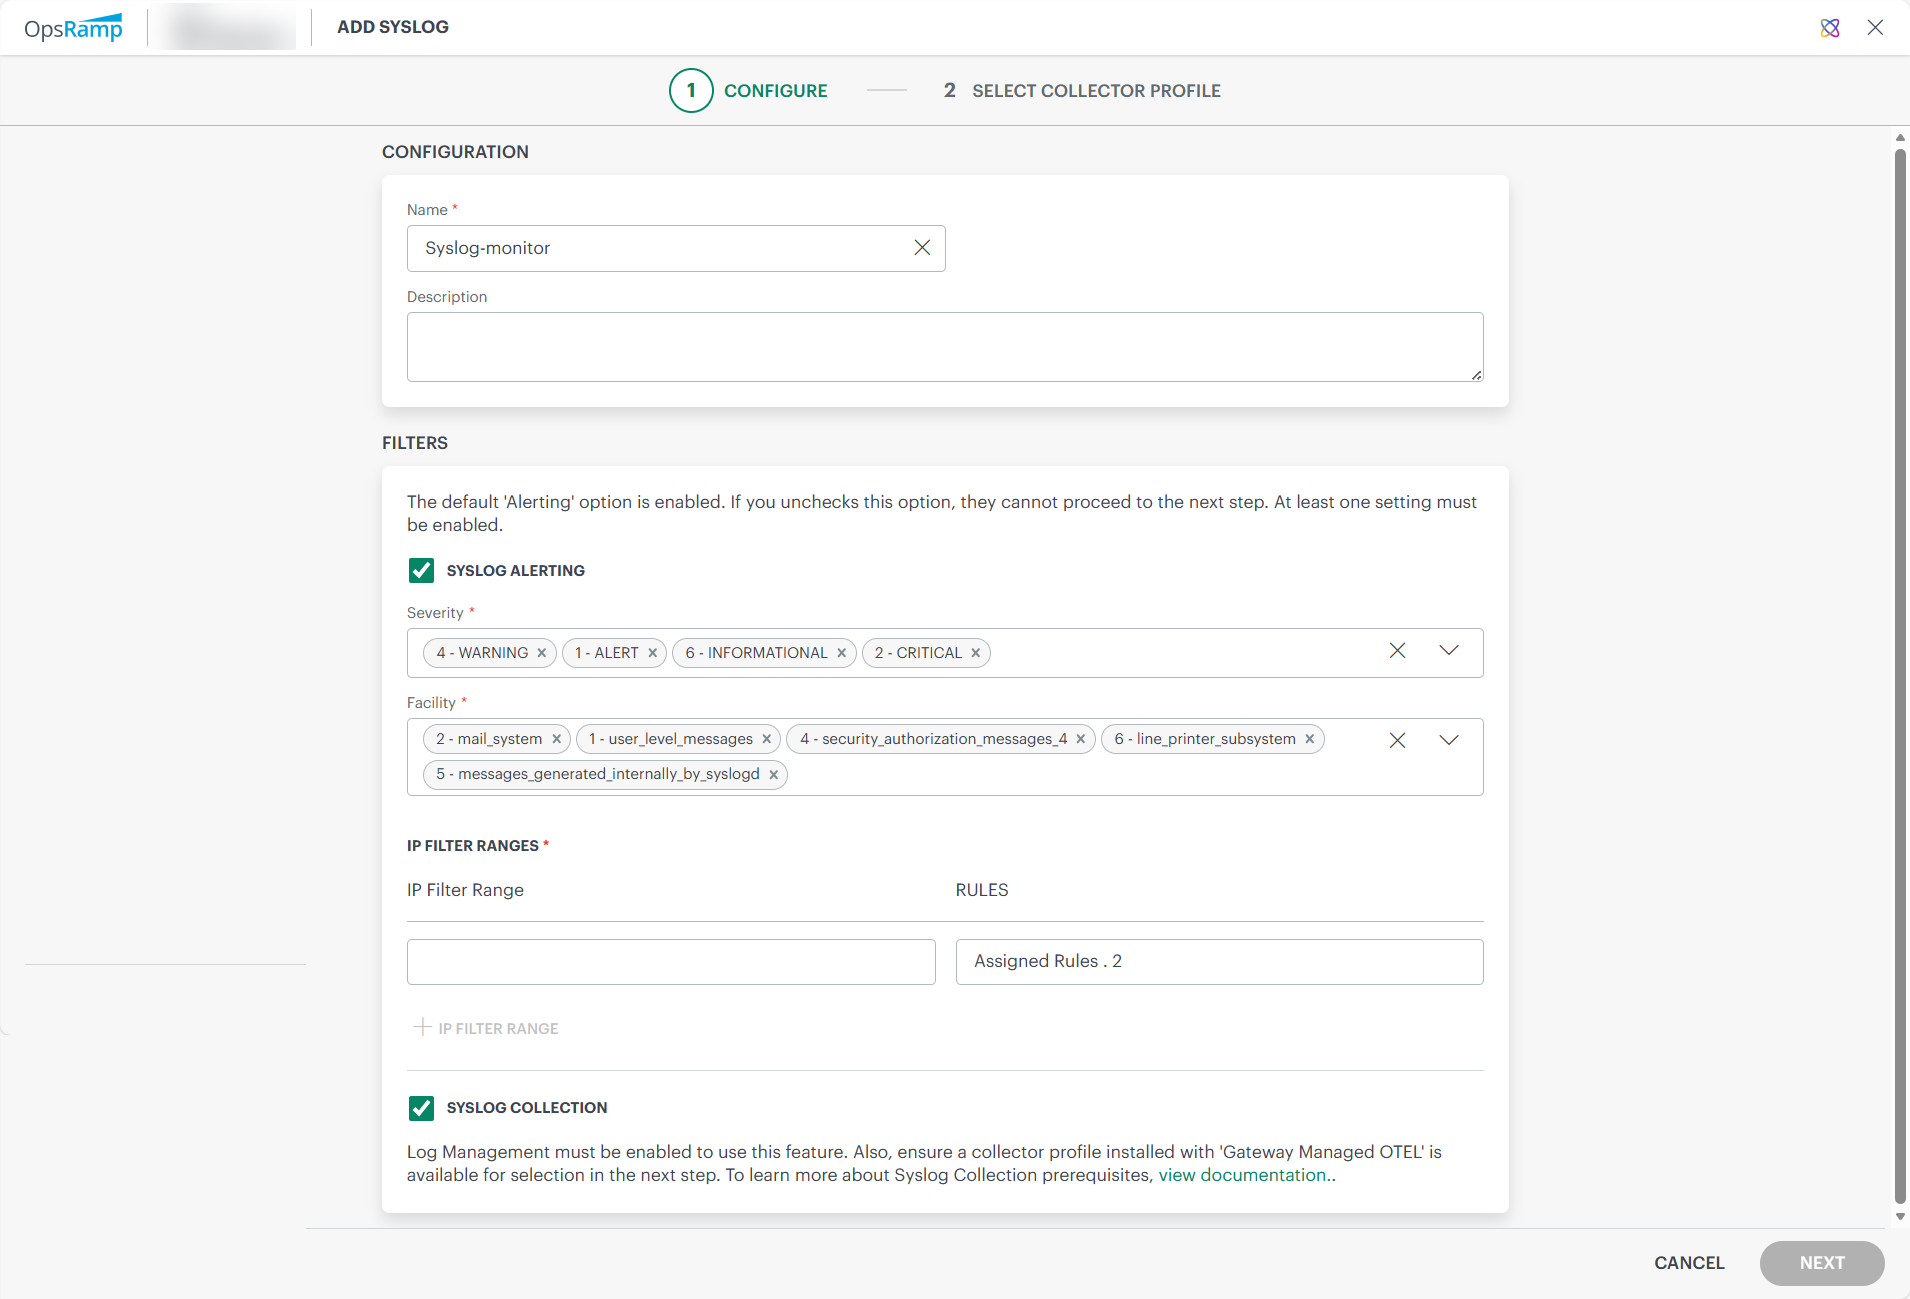
By default, the Syslog Alerting option is enabled.Enter the following information:
CONFIGURATIONField Name Field Type Description Name String (required) Enter Configuration name. Description String Provide a description. FILTERS
Field Name Field Type Description SEVERITY Dropdown (required) Select severity level from dropdown. See RFC 5424.
Syslog messages having selected severity level will only be processed. Rest of the messages will be dropped.FACILITY Dropdown (required) Type of message to monitor dropdown from RFC 5424.
Syslog messages having the selected facility codes will only be processed. Rest of the messages will be dropped.Click + or Add a IP range filter in the IP FILTER RANGE section. The ADD IP FILTER window is displayed.
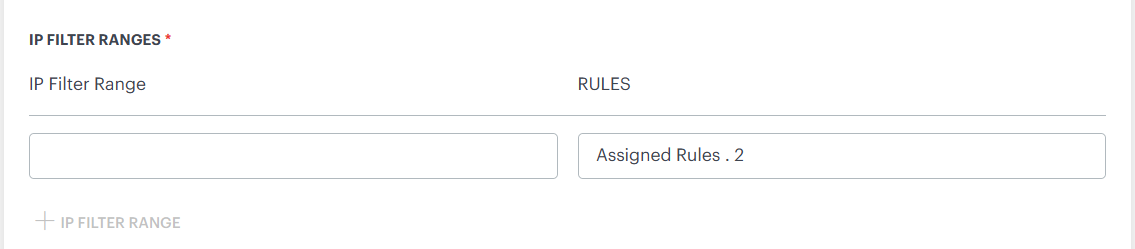
IP FILTER RANGE
| Field Name | Field Type | Description |
|---|---|---|
| IP Filter Range | String | (required) IP address range of servers to monitor syslog messages. Enter asterisk (*) to receive messages from all devices, although, this is not recommended because of the heavy traffic load imposed on the gateway. |
Click ADD IP FILTER in the ADD IP FILTER window. The details are added.
To view or modify the IP Filter details:
- Hover over the row and click action (three dots) icon.
- Select View Details.
- Edit the required fields and click SAVE.
To remove the IP Filter details:
- Hover over the row and click action (three dots) icon.
- Select Remove. A confirmation popup is displayed.
- Click REMOVE. The IP Filter is removed.
Follow these steps to configure syslog monitoring rules:
Click Assign Rules and select a rule from the list of rules.
The rule is added and listed in the RULES section.
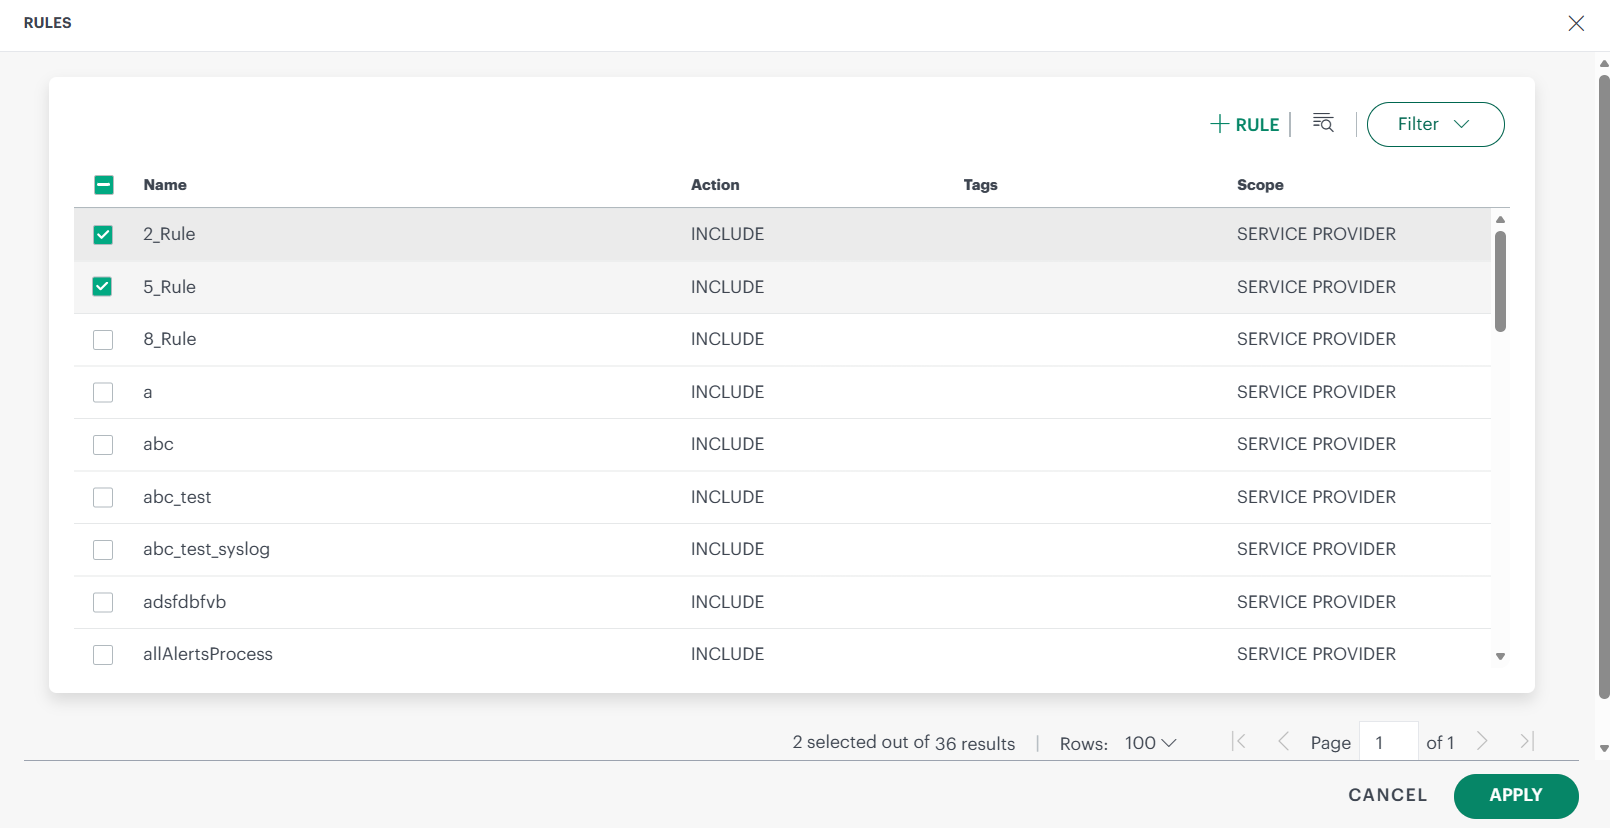
Click +RULE to create a new rule. Enter the required details and click ADD SYSLOG RULE.
Enter the following information:
Field Name Field Type Description Name String (required) Rule name. Action Dropdown (required) Action to apply to messages that match this rule: - INCLUDE: If the event matches a rule, it is processed further.
- EXCLUDE: If the event matches a rule, it will not be processed further.
RegEx Pattern String (required) RegEx pattern to apply for matching messages. Matching groups can be used as parameters, such as ${1}, in generating alert messages.Metric Name String (required) User-defined metric name, which can be specified using RegEx. Component String (required) User-defined component name. Alert Subject String (required) User-defined alert subject. Alert Description String User-defined Alert description. Alert Severity Dropdown (required) Alert severity level: - Critical
- Warning
- Info
- Ok
Tags String User-defined tag name.
Syslog Collection
Enable this option to collect Syslog messages. This option allows users to store received syslog events in the platform. The platform supports the RFC 5424 and RFC 3164 syslog formats. For unsupported formats, some fields may not be fully displayed.All collected logs can be viewed under Infrastructure → Logs.This feature is applicable only for Next Gen Gateway version 21.1.0 and above. This option is editable only when client level log management option is enabled.
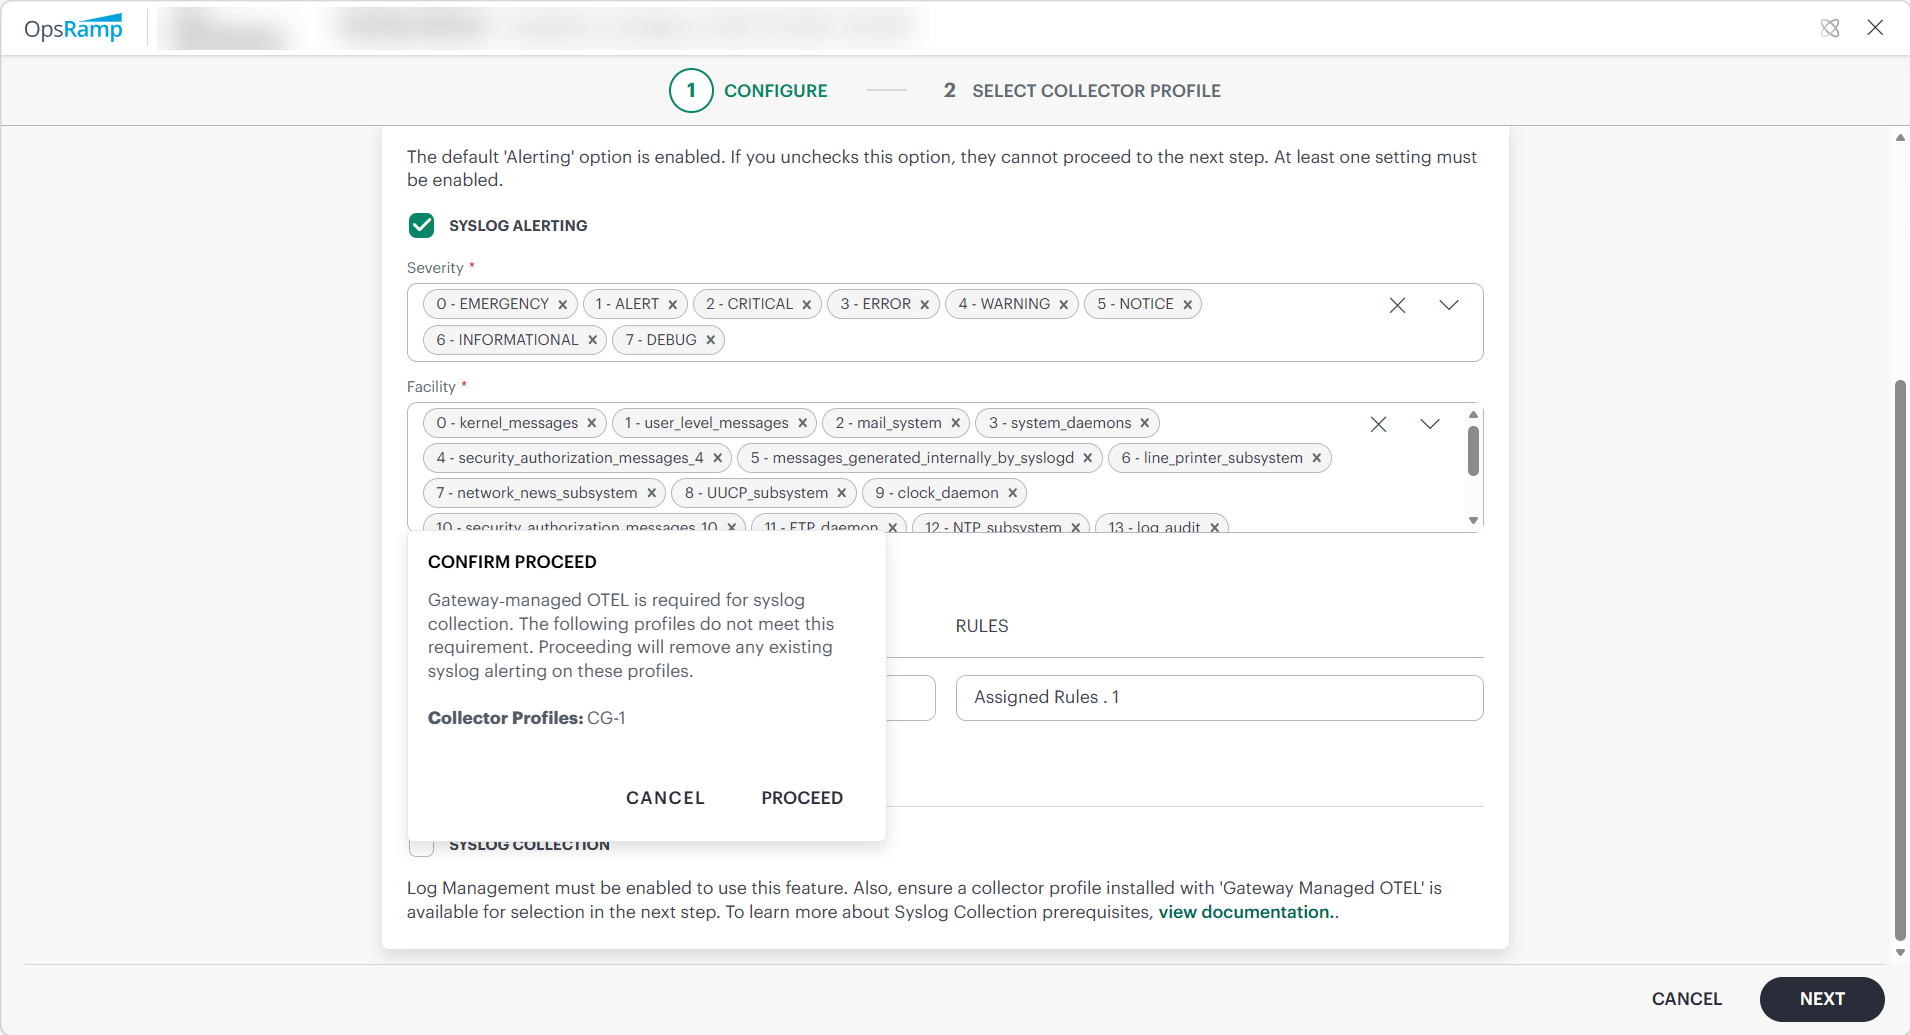
When enabling syslog collection, if you do not have a gateway with Gateway‑managed OpenTelemetry (OTel) integration set up, the system automatically shows this message. It is to inform you that logs cannot be collected without an OTel‑integrated gateway. The message also warns that the currently selected collector profiles do not meet this requirement, and if you choose to proceed, any existing syslog alerting configured on those profiles will be removed.
Click NEXT. The Select Collector Profile screen is displayed.
- If only Syslog Alerting is enabled on the configuration page, all gateways under the client are displayed.
- If Syslog Collection is enabled, only NextGen gateways with the gateway-managed OTEL application enabled are displayed.
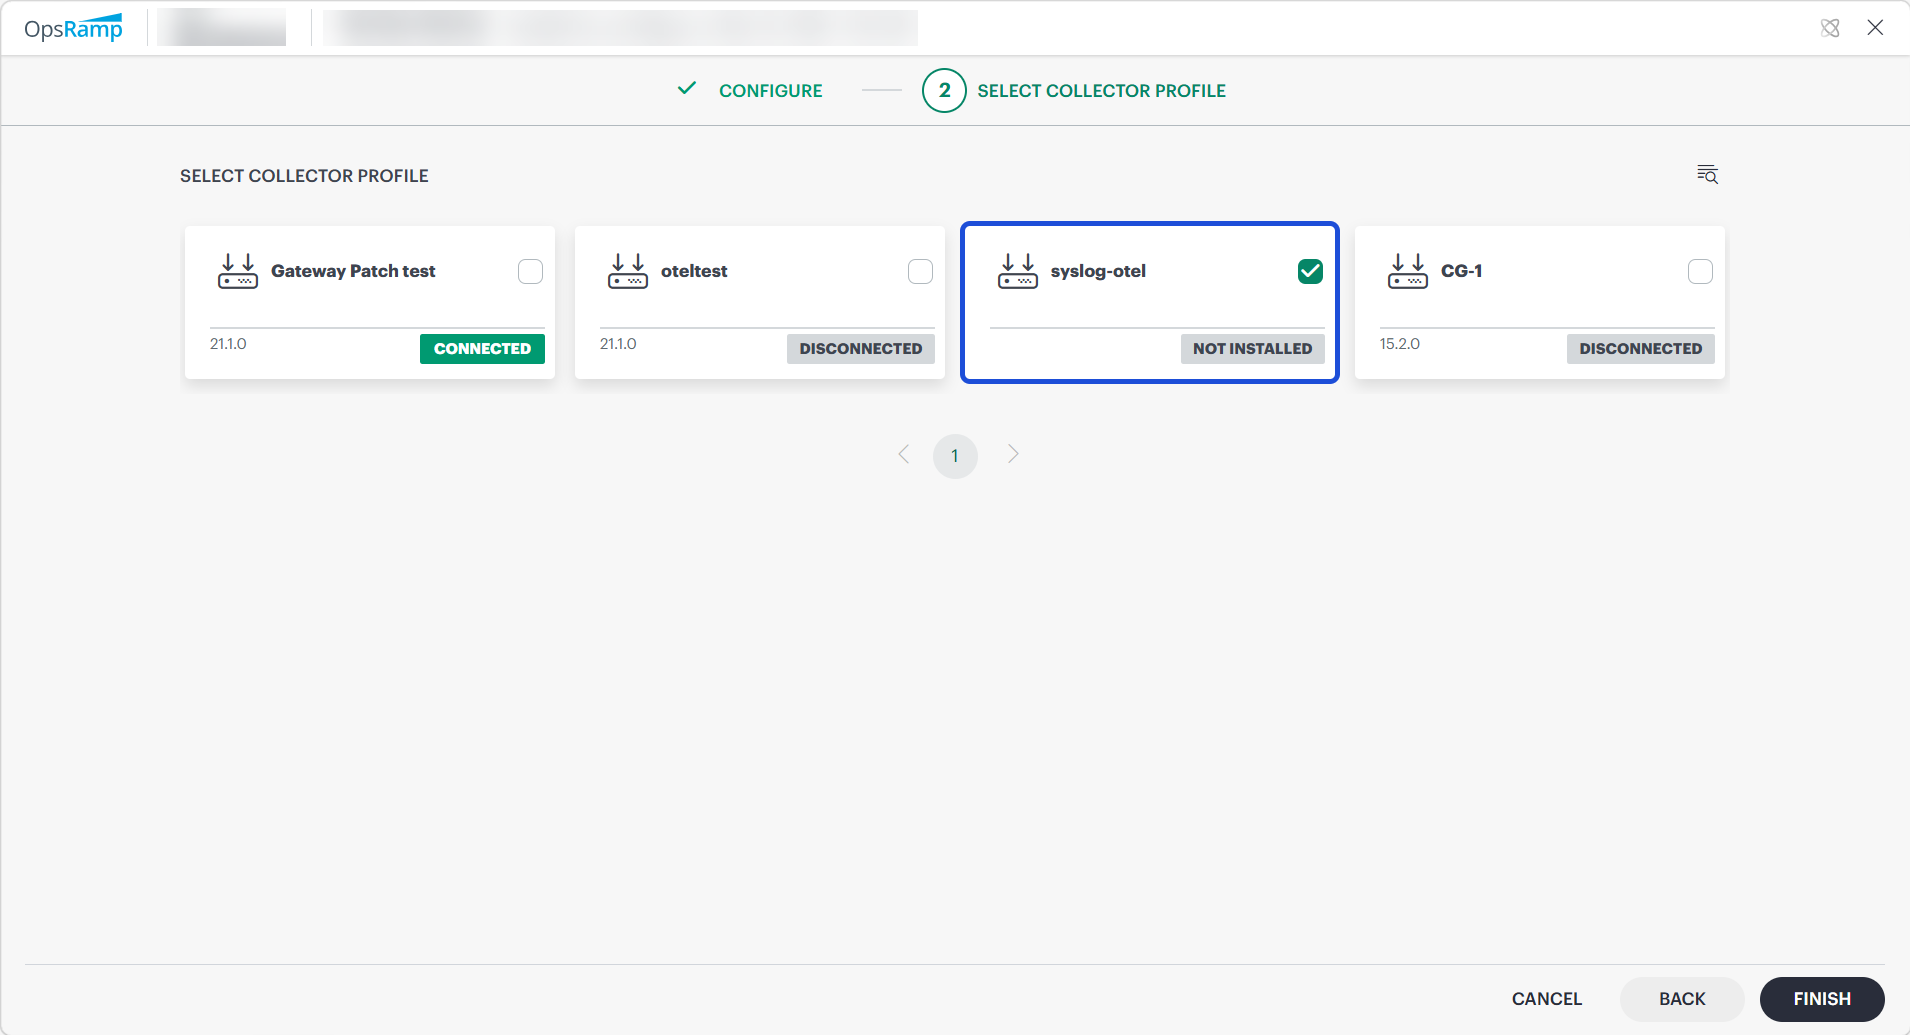
Select a collector profile that is connected.
Click FINISH.
Note
Enable at least one setting—Syslog Alerting or Syslog Collection—to proceed to the next step.The integration is installed and displayed on the Installed Integrations page. Use the search icon to search the installed integration.

Modify the Integration
See Modify an Installed Integration or Application article.
Note: Select SysLog Monitor Configuration.
How to process the received syslog event message
Syslog Alerting: Process syslog event messages as alerts
If any SysLog event is received by the gateway, it first checks the event Severity against the criteria specified in the first profile that is sorted alphabetically. If the severity matches, it proceeds to check the Facility. If the facility also matches, it proceeds to evaluate the Rules within that profile. If a rule is matched, the process stops; otherwise, it moves on to the next profile and repeats the same sequence of checks.
Examples:
- Let us consider three configuration profiles: P1, P2, and P3, and event E1 is received by the gateway. The gateway first checks the event against P1 profile. If event E1 matches the severity specified in profile P1, then the gateway checks the facility in profile P1. If it matches, then it proceeds to check the rules one by one in the P1 profile. If any of the rules in P1 do not match, the gateway moves on to profile P2 and checks the severity specified in the profile P2, it matches then checks the facility. If the facility matches the selected facility of the profile P2, it then checks the rules in the profile P2. If any of the rules match, the alert will be generated, and it will not check other profiles.
- If Event E2 is received by the gateway, it checks against profile P1. If the Severity of the event matches, then it checks the Facility in profile P2. If it matches, then it checks the rules in profile P1. If any of the rules do not match in profile P1 then it moves to profile P2. If it checks the severity of the profile P2 it matches, it checks the facility and it also matches, then checks the rules. If the rules do not match, then it moves to profile P3. If the severity of profile P3 does not match, the gateway will drop the event.
- If Event E3 is received by the gateway, it checks the Severity in profile P1. If it matches, then it proceeds to check the Facility in profile P1 and checks the rules in P1 one by one. If any rule matches in any profile, an alert is generated.
- If Event E4 is received by the gateway, it first verifies the Severity in profile P1. If it does not match, the gateway will drop the event.
- If Event E5 is received by the gateway, it initially verifies the Severity in profile P1. If it matches, then it proceeds to check the Facility in profile P1. If the facility does not match, the gateway will drop the event.
Syslog Collection: Process and forward syslog event messages for log management
When a Syslog event is received by the gateway, it first verifies whether log collection is enabled in the Syslog configuration and ensures that all required log collection prerequisites are met.
If these conditions are satisfied, the gateway determines the Syslog message format. OpsRamp supports RFC 5424 and RFC 3164 formats. For more information, see RFC 5424 - The Syslog Protocol and RFC 3164 - The BSD Syslog Protocol. Based on the detected format, the gateway parses the event, converts it into OTEL format, and forwards it to the gateway-managed OpenTelemetry (OTEL) collector for further processing.
When a Syslog event does not support formats, the event is converted to the OTEL format and forwarded; however, attribute extraction may be incomplete, and certain fields may not appear in the platform.
The collector applies the filters defined in the YAML configuration:
- If a Syslog event matches the defined filters, it is dropped.
- If it does not match any filters, it is forwarded to the OpsRamp Cloud platform.
Syslog events are processed and sent to the cloud.Processed logs can be viewed in Infrastructure → Logs UI.
Syslog Fields and Descriptions
| Field Name | Description |
|---|---|
| resourceName | The name of the resource or device from which the log is received.
Typically derived from the hostname; if the hostname is not available,
the IP address of the resource or device is used. |
| appname | The name of the application that generated the log message (RFC 5424).
Not available in RFC 3164; optional for unsupported formats. |
| collectorName | The name of the OTEL collector or gateway that processed the Syslog event
(RFC 5424, RFC 3164). |
| facility | Indicates the system component that generated the message.
Derived from the priority (PRI) (RFC 5424, RFC 3164).Valid range: 0 to 23.If priority is within the valid range, facility is extracted; otherwise, it may be optional for unsupported formats. facility = priority / 8 |
| hostname | The hostname of the device or system that generated the Syslog message
(RFC 5424, RFC 3164);
optional for unsupported formats. |
| ipaddress | The IP address of the source device sending the Syslog event
(RFC 5424, RFC 3164). |
| level | The severity level of the log.
Derived from severity, which is extracted from the priority (PRI)
(RFC 5424, RFC 3164).Severity range: 0 to 7
(0 = Emergency, 1 = Alert, 2 = Critical,
3 = Error, 4 = Warning, 5 = Notice,
6 = Info, 7 = Debug).If priority is within range, level is populated; otherwise, displayed as Unknown for unsupported formats.severity = priority % 8 |
| priority | The priority (PRI) value present in the Syslog event
(RFC 5424, RFC 3164), which encodes both facility and severity.Valid range: 0 to 191.If the value falls within this range, it is parsed and populated as the priority attribute, even for unsupported formats. If the value is outside this range, the priority field is treated as optional and may not be populated. (PRI = facility × 8 + severity) |
| proc_id | The process ID (PID) of the application (RFC 5424).
Not available in RFC 3164; optional for unsupported formats. |
| source | Identifies the origin of the log.
Value will be displayed as syslog_server. |
| syslog_protocol | Indicates the Syslog format used
(for example, rfc5424 or rfc3164);
displayed as unknown for unsupported formats. |
| syslog_version | The version of the Syslog protocol
(for RFC 5424, this is typically 1).
Not applicable for RFC 3164;
optional for unsupported formats. |
| structured data elements | Key-value pairs providing additional context (RFC 5424).
In the original Syslog message, structured data is represented in the format
[SD-ID param="value"].
In the OpsRamp platform, these elements are parsed and displayed as flattened
key-value pairs for easier readability and filtering.Example: Structured data [timeQuality@32473 tzKnown="3" isSynced="2" syncAccuracy="449000"]
is displayed in the UI as:• timeQuality.isSynced = 2• timeQuality.syncAccuracy = 449000• timeQuality.tzKnown = 3Not available in RFC 3164;
optional for unsupported formats. |
| type | The type/category of the log message.
Value will be displayed as log. |
| message | The actual log message content.
In RFC 5424, this corresponds to the MSG part;
in RFC 3164, it represents the message portion after the header
(RFC 5424, RFC 3164).
For unsupported formats, the entire or partially parsed Syslog message is displayed. |
Additional Information
SysLog events can be categorized into 8 types of events based on severity: Emergency, Alert, Critical, Error, Warning, Notice, Informational, and Debug. OpsRamp can generate Critical, Warning, OK, and Info alerts. These alerts are generated based on rules defined in the OpsRamp UI.
If you want an OK alert, you must define a specific rule for it. If the OK alert needs to be appended to an existing critical/warning alert, the OpsRamp tool allows it, but it requires the Metric name, component name, and resource to remain the same; otherwise, it generates a separate alert.
The Priority value is calculated by first multiplying the Facility number by 8, and then adding the numerical value of the Severity.
Related Topics
- To resolve frequently occurring issues in Syslog, refer Troubleshooting Steps section.